A few days ago in my hands-on series, I mentioned using VSCode + Linux VM to debug PostgreSQL source code. Some fellow developers asked me about the detailed process, so this article will describe the complete workflow to help you get started.
Environment Setup
Configure Linux Virtual Machine
VM Version
For new environments, I recommend installing CentOS 8 or above, as the current official VSCode version requires glibc 2.28 or higher.
Starting with VS Code release 1.99 (March 2025), the prebuilt servers distributed by VS Code are only compatible with Linux distributions that are based on glibc 2.28 or later.
If you don't want to spend extra time compiling a higher version of glibc, install CentOS 8.3 directly.
[root@node1 ~]# cat /etc/redhat-release
CentOS Linux release 8.3.2011
Database Compilation and Installation
I won't go into detail about database compilation. Download the source code, extract it, install the required dependencies, and execute compilation.
Here are my commonly used parameters:
export CFLAGS='-g -O0 -Wall -Wmissing-prototypes -Wpointer-arith -Wdeclaration-after-statement -Wendif-labels -Wformat-security -fno-strict-aliasing -fwrapv'

./configure --prefix=/home/18pg/local --with-perl --with-tcl --with-python --with-openssl --with-pam --without-ldap --with-libxml --with-libxslt --enable-thread-safety --with-wal-blocksize=8 --with-blocksize=8 --enable-dtrace --enable-debug && make -j4 && make install
Configure VSCode
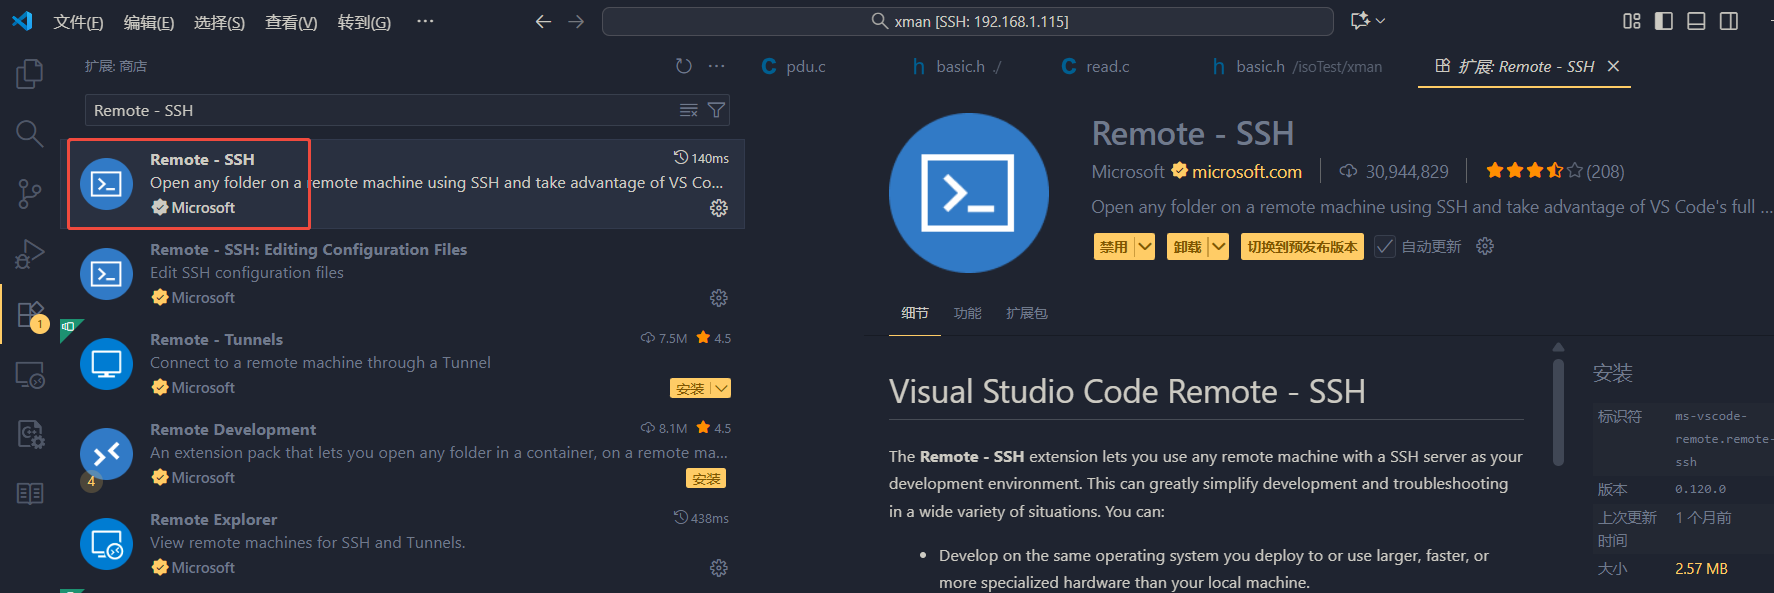
Download VSCode from the official website. After installation, search for the Remote - SSH extension in the Extensions panel and install it.
Connect to Virtual Machine
After installing the Remote-SSH plugin, a computer icon will appear in the left sidebar. Switch to that panel and click "New Remote".
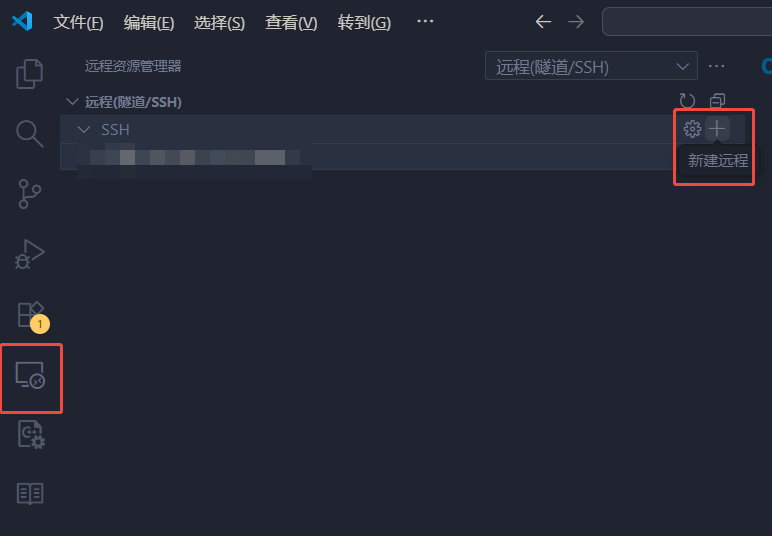
The connection format is username@ip. I usually use the root user for developing and debugging PostgreSQL source code.

If you need to debug tools like pg_probackup or pg_waldump, you must use the database installation user (e.g., postgres) to access the proper library environment.

Open Directory
After connecting successfully, select your source code directory.
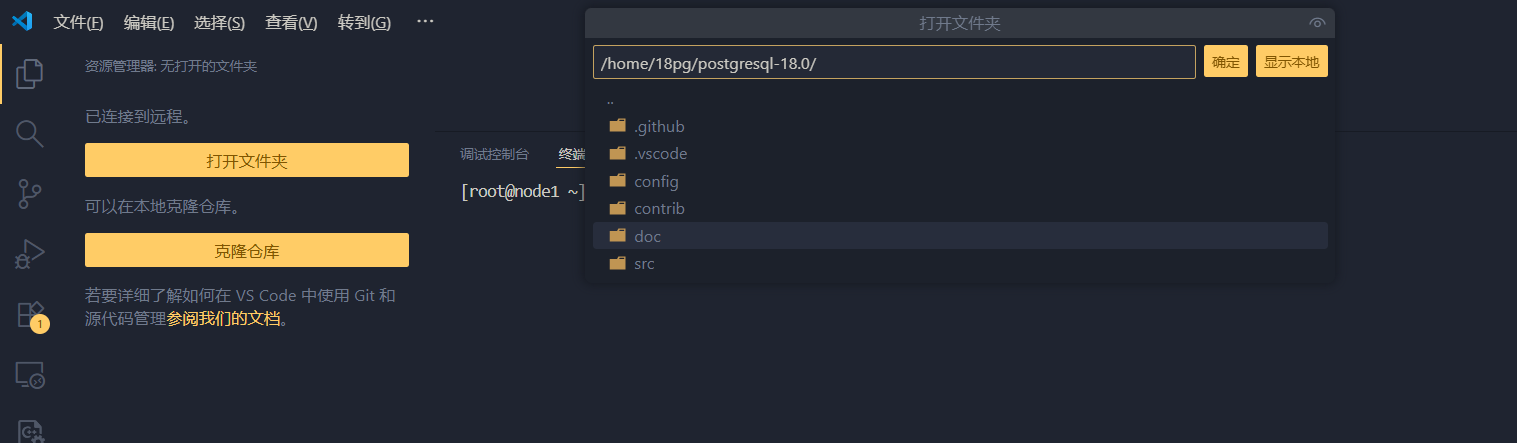
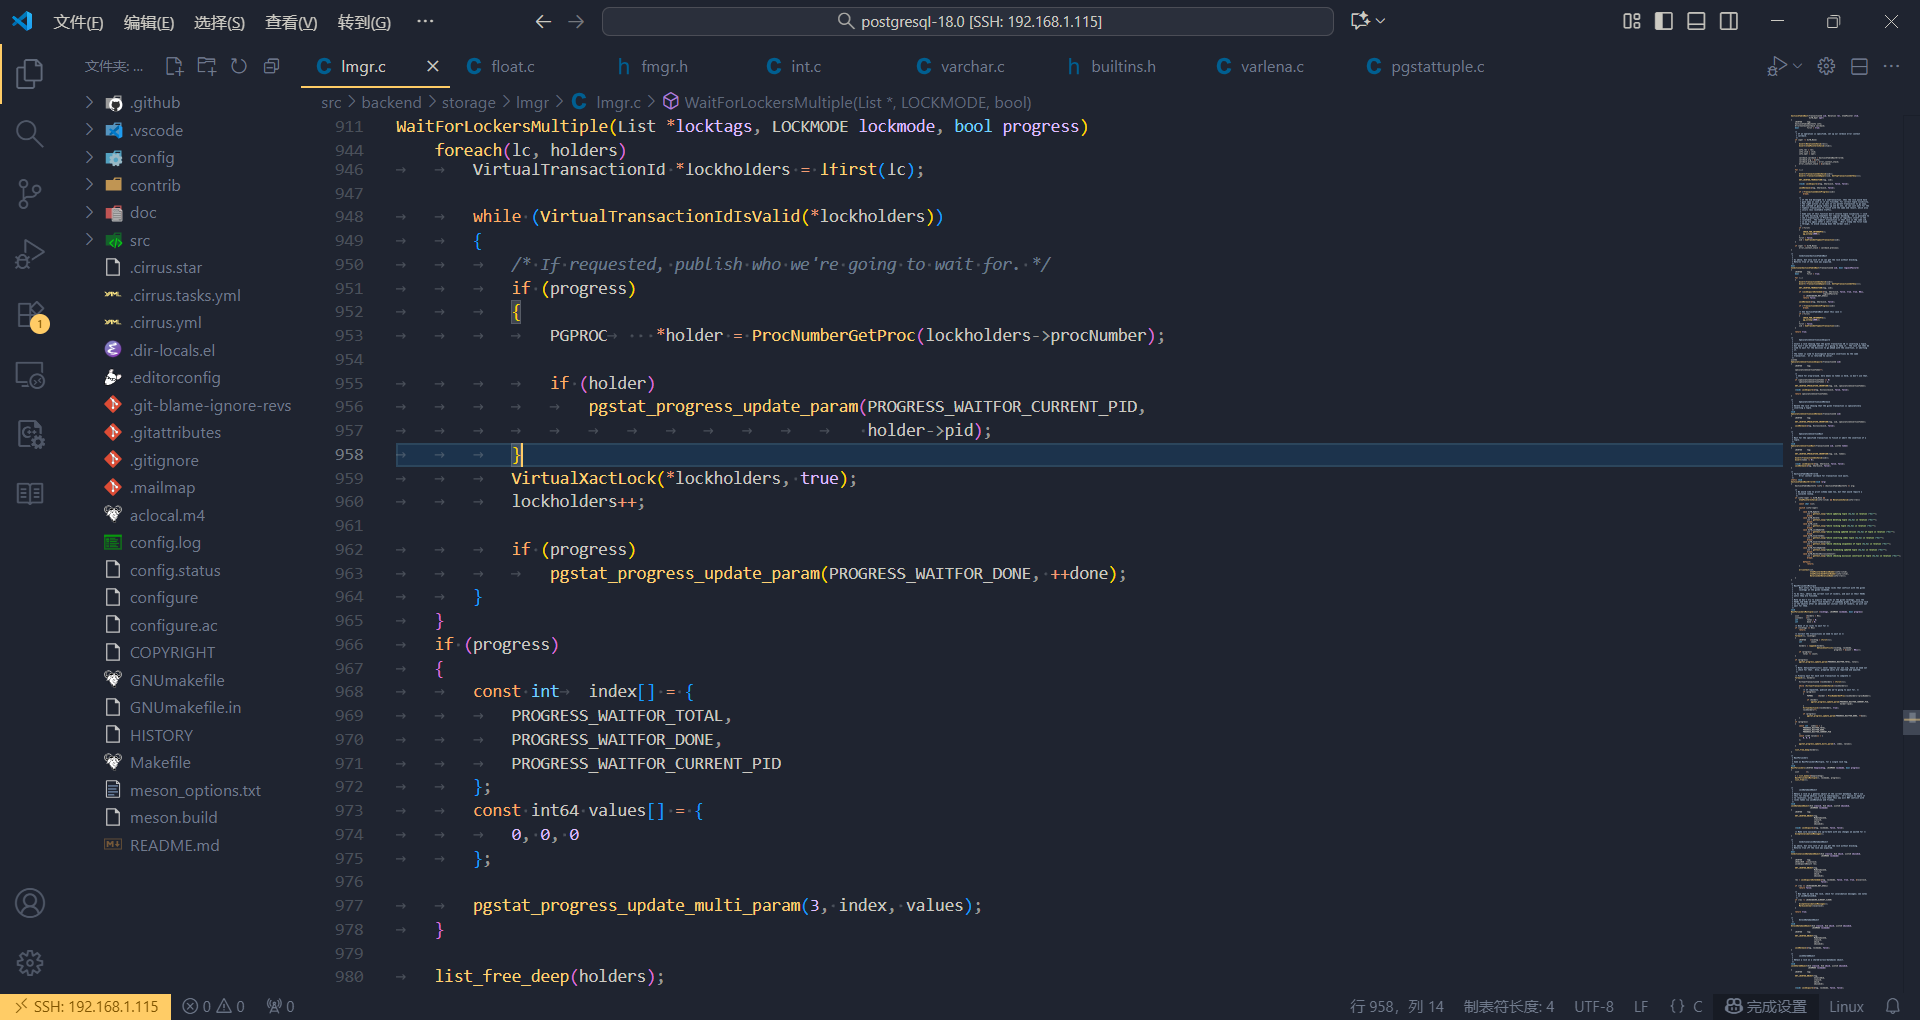
Now you can read the source code directly in VSCode. Even without debugging, VSCode is an excellent source code browsing and searching tool.
Debug PostgreSQL Source Code
After opening the source directory, how do we actually run and debug the code?
Configure .vscode Directory
First, create a .vscode folder in your opened source code directory.
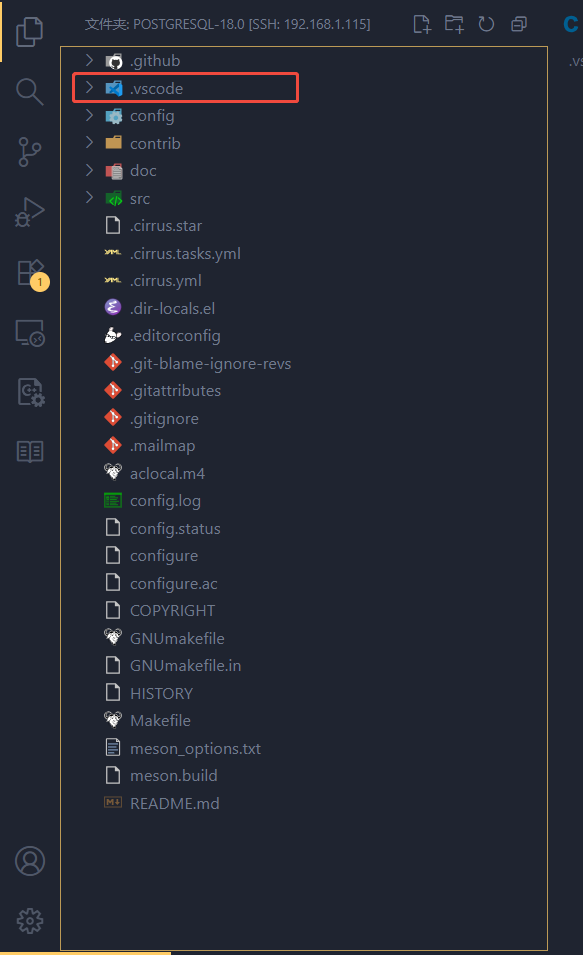
- Note: Make sure to create it at the top-level directory.
Then create a file named launch.json in the .vscode folder.
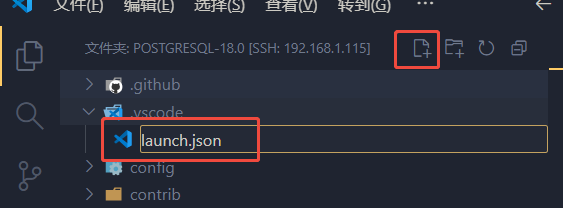
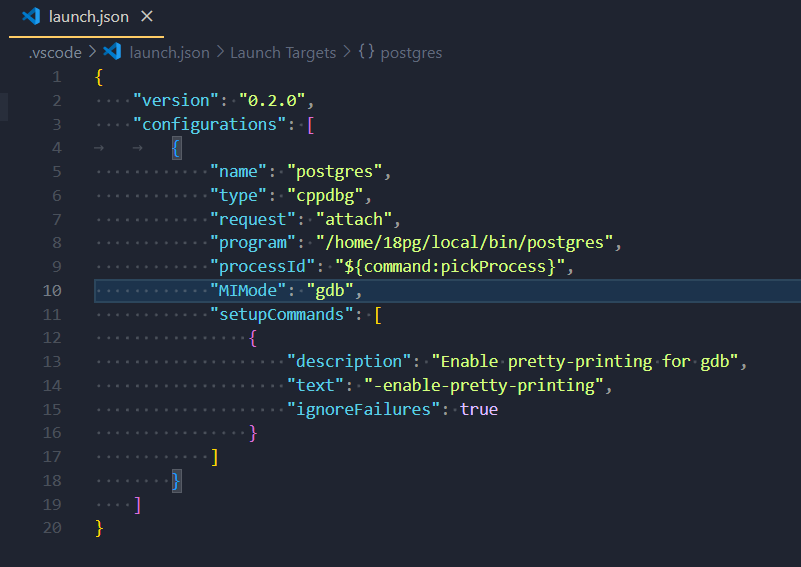
Copy and paste the following content, changing the program path to your own postgres program location:
{
  "version": "0.2.0",
  "configurations": [
    {
      "name": "postgres",
      "type": "cppdbg",
      "request": "attach",
      "program": "/home/18pg/local/bin/postgres",
      "processId": "${command:pickProcess}",
      "MIMode": "gdb",
      "setupCommands": [
        {
          "description": "Enable pretty-printing for gdb",
          "text": "-enable-pretty-printing",
          "ignoreFailures": true
        }
      ]
    }
  ]
}
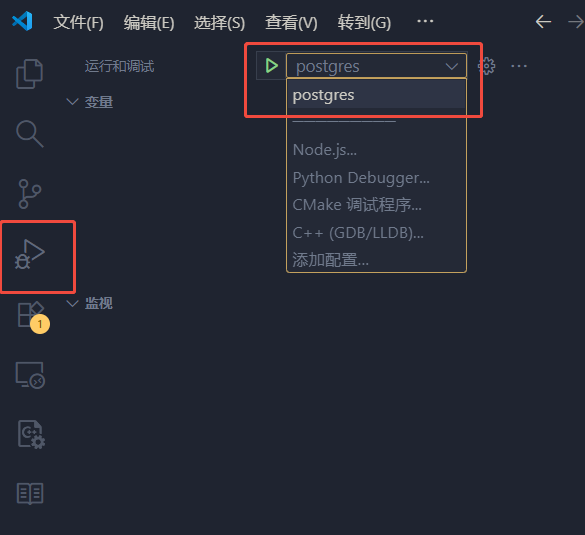
After creating the launch.json file, click the bug icon on the left sidebar. You'll see an option named postgres, which is the name field we set in launch.json.
Start a psql Client
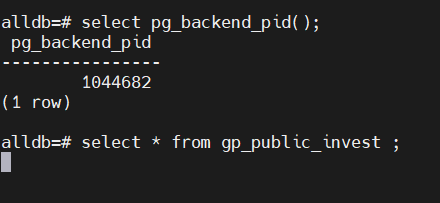
Before starting the debugger, go to the Linux command line, execute psql to enter the database, and run select pg_backend_pid() to get the current session's pid. In this case, it's 1044682. Copy this ID.
[18pg@node1 ~]$ psql alldb
psql (18.0)
Type "help" for help.

alldb=# select pg_backend_pid();
 pg_backend_pid
----------------
        1044682
(1 row)
Start postgres Debugger
Click the green triangle, and you'll be prompted to attach to a process.
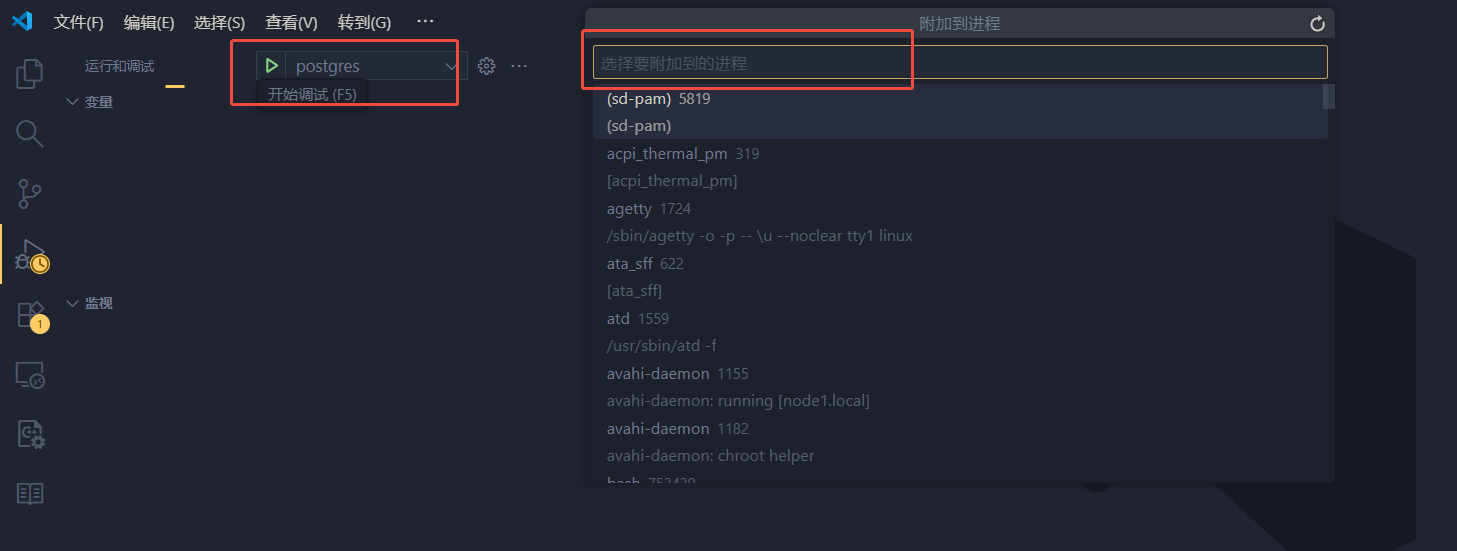
Simply paste the ID we copied in the previous step.

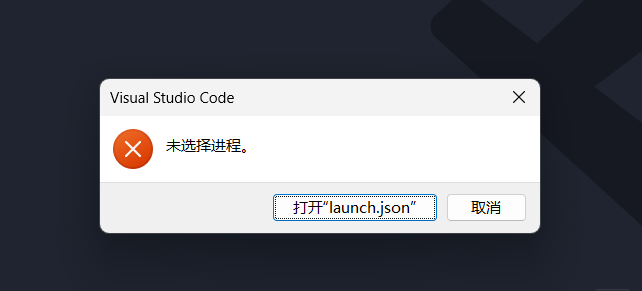
- Note: If you don't paste the ID immediately after clicking the green triangle and switch away, a timeout dialog will appear. Just cancel and click the green triangle again.
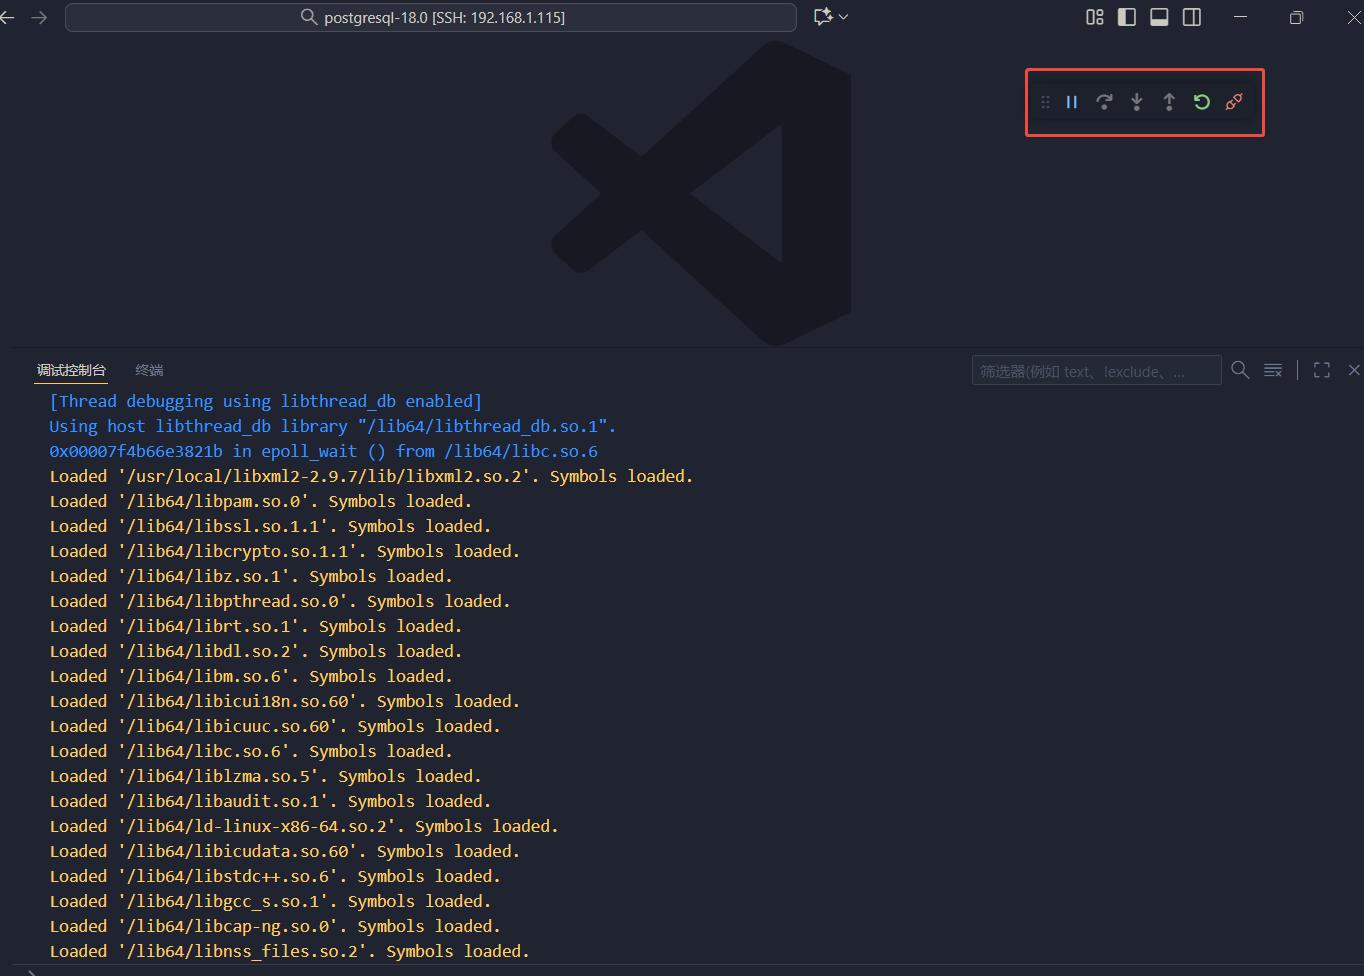
After entering the ID and pressing Enter, if you see the red box style on the right, the debugging process has started successfully.
Set Breakpoints and Debug
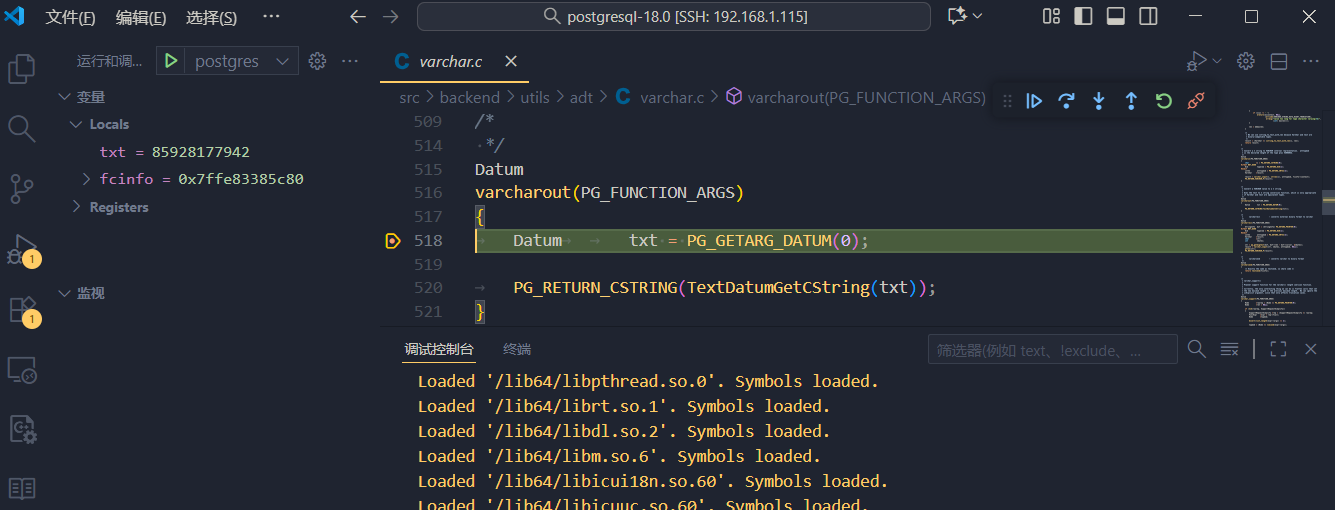
Now you can set breakpoints on code you're interested in. For example, I set a breakpoint in the varchar function parsing code. Simply click on the left side of the code line to create a yellow dot, and it will also appear in the "Breakpoints" panel on the right.
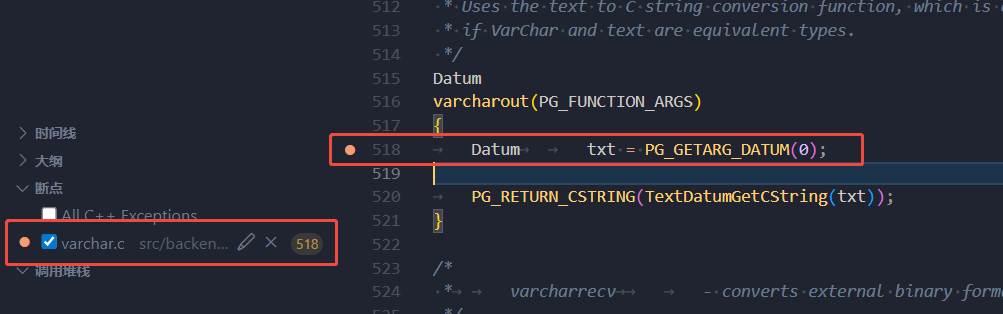
Return to the command-line session and execute a SELECT query. The statement will hang.
VSCode will show the following, indicating that the SELECT statement has reached this function.
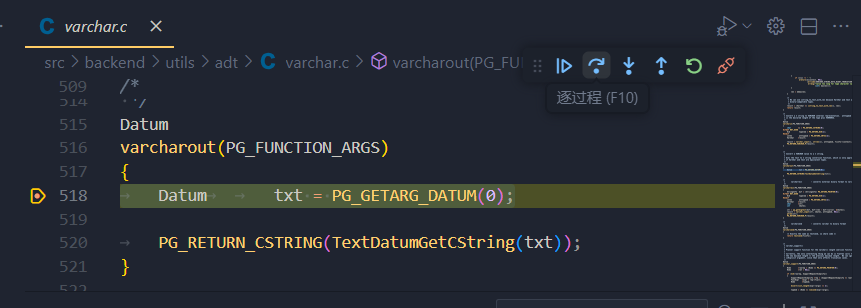
- To go directly from line 518 to 519, click "Step Over"
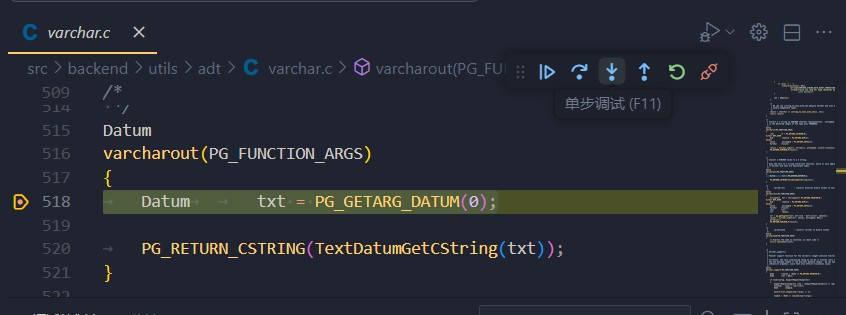
- To enter the PG_GETARG_DATUM function on line 518, click "Step Into"
- To skip the current breakpoint and continue to the next breakpoint, click "Continue"
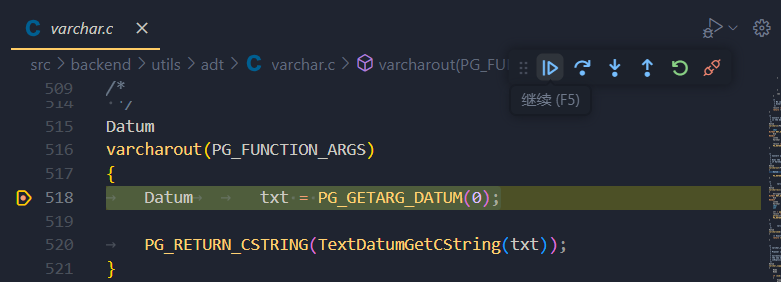
Debug Tool Source Code
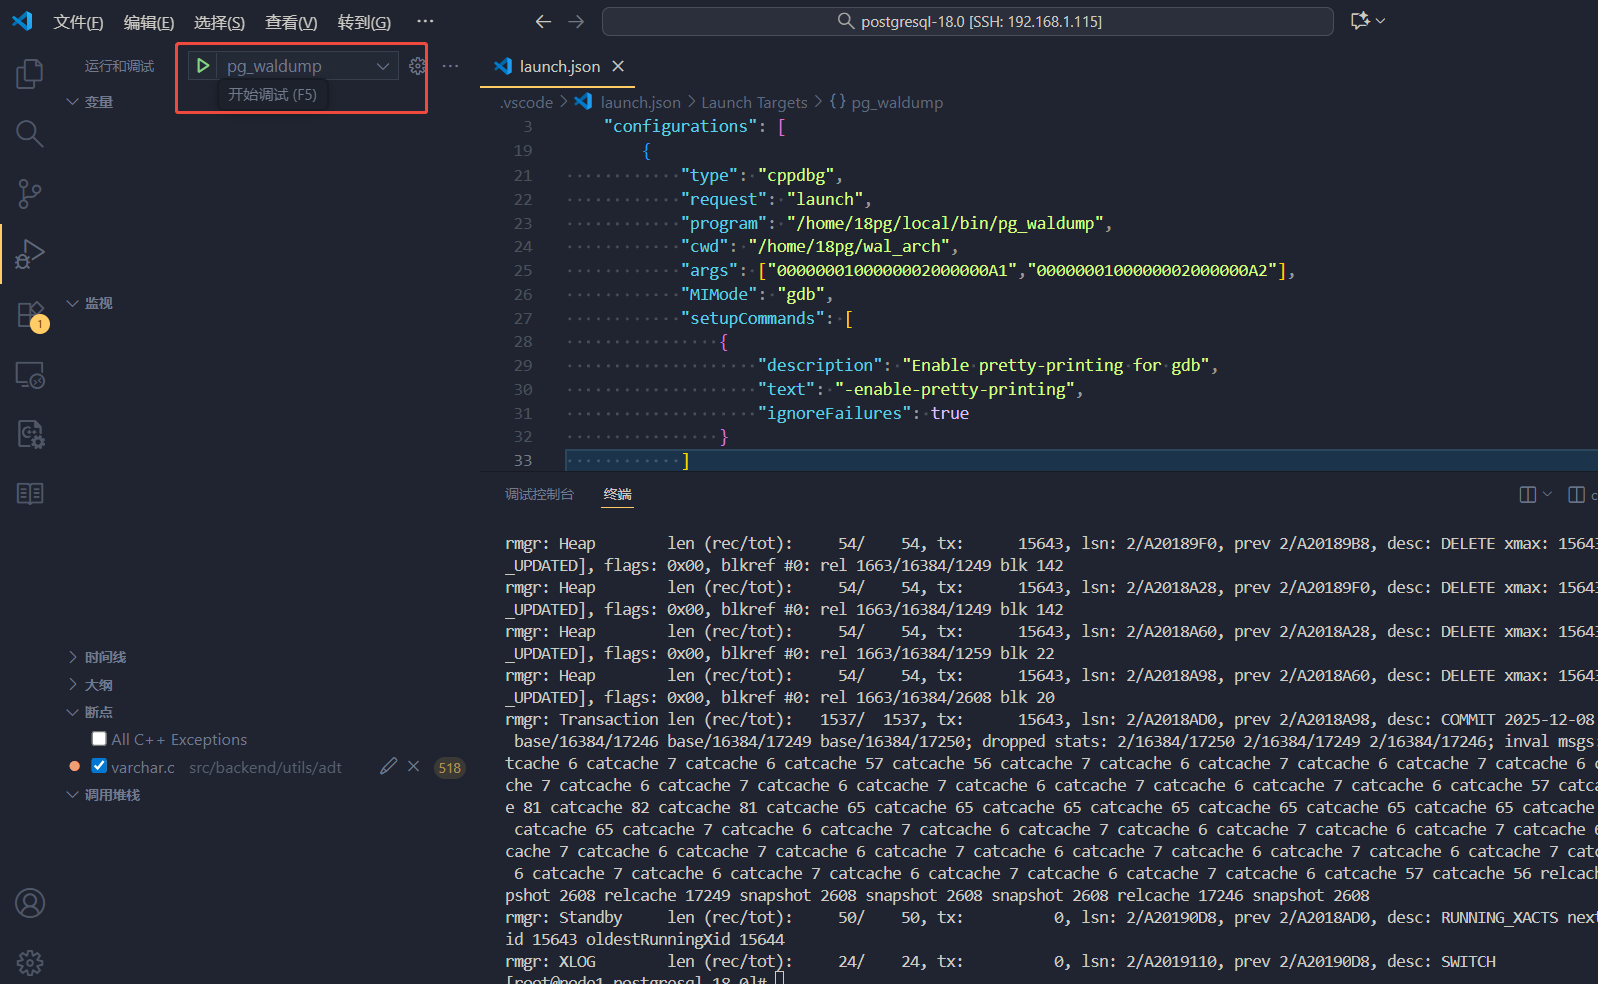
When we need to debug PostgreSQL peripheral tools like pg_probackup or pg_waldump, the above debugging approach won't work. We need to adjust the launch.json file content.
Suppose we want to debug the command pg_waldump 0000000100000002000000A1 0000000100000002000000A2. The launch.json content would be:
{
  "version": "0.2.0",
  "configurations": [
    {
      "name": "pg_waldump",
      "type": "cppdbg",
      "request": "launch",
      "program": "/home/18pg/local/bin/pg_waldump",
      "cwd": "/home/18pg/wal_arch",
      "args": ["0000000100000002000000A1", "0000000100000002000000A2"],
      "MIMode": "gdb",
      "setupCommands": [
        {
          "description": "Enable pretty-printing for gdb",
          "text": "-enable-pretty-printing",
          "ignoreFailures": true
        }
      ]
    }
  ]
}
Four changes were made:
requestmethod changed from attach to launchprogrampath changed to the pg_waldump program path- Added
argsparameter to set program arguments, each enclosed in quotes and separated by commas - Added
cwdparameter to set the current execution path, here set to the WAL archive path
With this configuration, clicking the green button is equivalent to directly executing pg_waldump 0000000100000002000000A1 0000000100000002000000A2. We just need to set breakpoints at the code locations we want to observe.
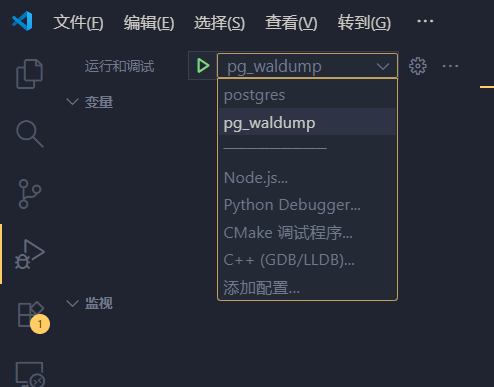
Additionally, we can write multiple debug programs in the same launch.json file and switch between them freely:
{
  "version": "0.2.0",
  "configurations": [
    {
      "name": "postgres",
      "type": "cppdbg",
      "request": "attach",
      "program": "/home/18pg/local/bin/postgres",
      "processId": "${command:pickProcess}",
      "MIMode": "gdb",
      "setupCommands": [
        {
          "description": "Enable pretty-printing for gdb",
          "text": "-enable-pretty-printing",
          "ignoreFailures": true
        }
      ]
    },
    {
      "name": "pg_waldump",
      "type": "cppdbg",
      "request": "launch",
      "program": "/home/18pg/local/bin/pg_waldump",
      "cwd": "/home/18pg/wal_arch",
      "args": ["0000000100000002000000A1", "0000000100000002000000A2"],
      "MIMode": "gdb",
      "setupCommands": [
        {
          "description": "Enable pretty-printing for gdb",
          "text": "-enable-pretty-printing",
          "ignoreFailures": true
        }
      ]
    }
  ]
}
Continue with PDU
The article explains the problem; the PDU homepage presents the tool, workflow, and real recovery scenarios.